You poured budget into ads last month, but can you say, with confidence, whether it actually paid off? Learning how to calculate ROAS, your return on ad spend, answers that in one number. Most marketers track clicks and impressions while the real question goes unanswered: is every dollar spent on advertising coming back as revenue, or quietly leaking away? ROAS cuts through the noise. In this guide you’ll get the simple ROAS formula, worked examples, the difference between ROAS and ROI, and what a good ROAS looks like, so you can stop guessing and start making budget decisions you can defend.
How to Calculate Return on Ad Spend (ROAS)
If you spend money on ads, you need one number that tells you whether that money is coming back with friends or quietly disappearing. That number is ROAS. It is the simplest honest answer to the question every marketer asks after a campaign goes live: did this actually work?
ROAS, short for return on ad spend, measures the revenue from ads against what you paid to run them. Calculate ROAS by dividing the revenue generated by an ad by the cost of ads. That is the whole formula. The hard part is not the math. The hard part is feeding it the right numbers, reading the result honestly, and knowing what to do next.
This guide walks through the ROAS formula, real examples, the difference between ROAS and ROI, what a good ROAS looks like, and how to improve ROAS once you know where you stand.
What Is ROAS in Marketing?
ROAS is a marketing metric that tells you how much ad revenue you earn for every dollar spent on advertising. Think of it as the efficiency rating of your paid ads. A ROAS of 4 means you earned four dollars in revenue for every one dollar you put into the campaign.
Marketers use ROAS because it cuts through vanity numbers. Clicks feel good. Impressions look impressive in a slide deck. But neither pays the bills. ROAS focuses on the only thing that matters for an advertising campaign: the relationship between spend and the amount of revenue it brings back. Whether you run Google Ads, Meta, TikTok, or a small email promotion, ROAS gives you a common language to compare them.
When people say “learn what ROAS means,” they usually want this one-line version: ROAS measures revenue from ads divided by advertising spend. Everything else in this article builds on that.
Why Return on Ad Spend Matters for Every Campaign
Every dollar spent on advertising is a bet. ROAS tells you which bets are paying off and which ones you should fold.
Without it, you are flying blind on budget allocation. Say you run three campaigns and they all “feel” successful. ROAS shows you that campaign A returns 6:1, campaign B sits at 2:1, and campaign C is losing money. Now your next budget decision writes itself. Pour more into A, fix or pause C. That is the practical value of tracking ROAS. It turns gut feeling into a decision you can defend in a meeting.
ROAS also keeps your marketing strategy grounded in profitability instead of activity. Plenty of teams stay busy launching creatives and tweaking audiences while the underlying advertising cost quietly outruns revenue. Knowing how to calculate ROAS, and checking it regularly, is what keeps your marketing efforts honest.
How to Calculate Return on Ad Spend (ROAS)
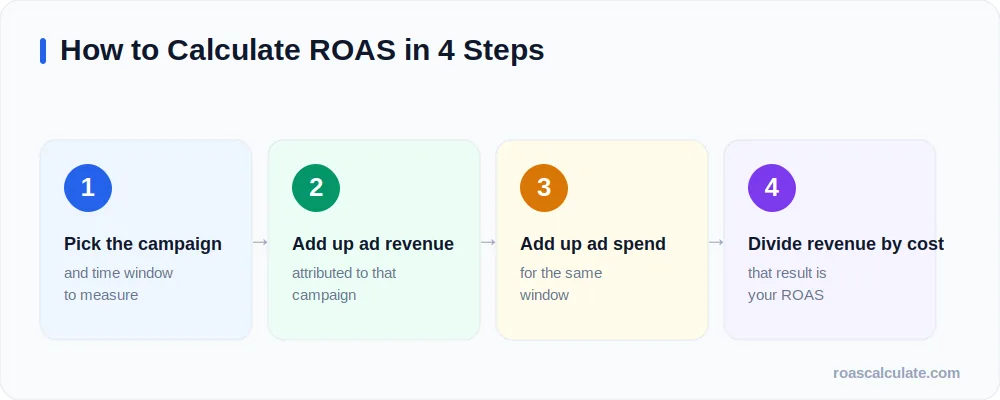
Here is the process, step by step.
- Pick the campaign and time window you want to measure. A week, a month, a single ad campaign, whatever you need.
- Add up the total revenue from ads in that window. This is the ad revenue directly attributed to the campaign, not your whole store’s sales.
- Add up the advertising spend for the same campaign and window. Include media cost, and ideally any fees tied to running it.
- Divide revenue by cost.
That final division is your ROAS. Do it for one campaign or roll it up into an overall ROAS across all your digital marketing efforts. Same method either way.
ROAS Formula Explained
The ROAS formula is short enough to memorize:
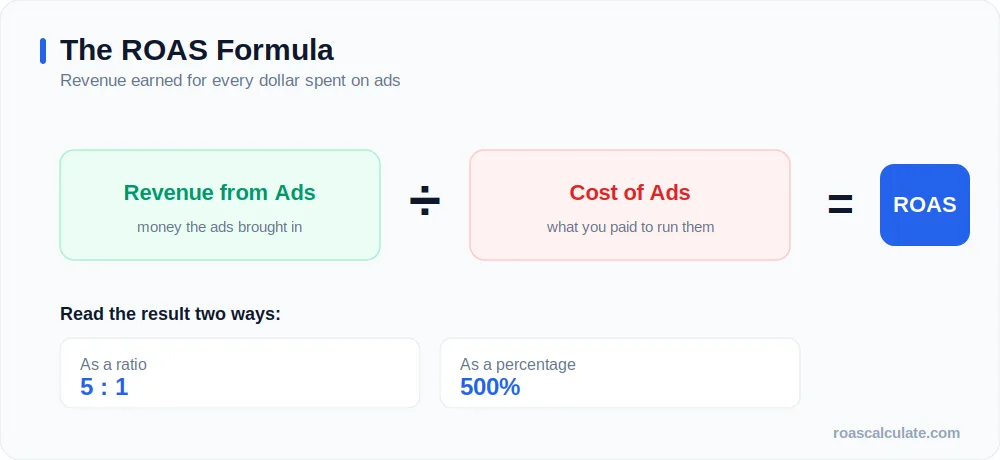
ROAS = Revenue from Ads ÷ Cost of Ads
You can read the result two ways, and both are correct. ROAS as a ratio looks like 5:1, which reads as “five dollars earned for every dollar spent.” ROAS as a percentage multiplies that by 100, so the same result becomes 500%. The ROAS ratio is more common in conversation, the percentage shows up more in dashboards. Pick whichever your team reads faster.
One thing worth saying plainly: the formula only uses revenue and ad cost. It does not subtract your product costs, shipping, or salaries. That keeps the ROAS calculation clean and fast, but it also means a high ROAS figure is not the same as profit. Hold that thought, because it matters when we get to break-even ROAS.
ROAS Calculation Formula with Examples
Numbers make this click faster than definitions.
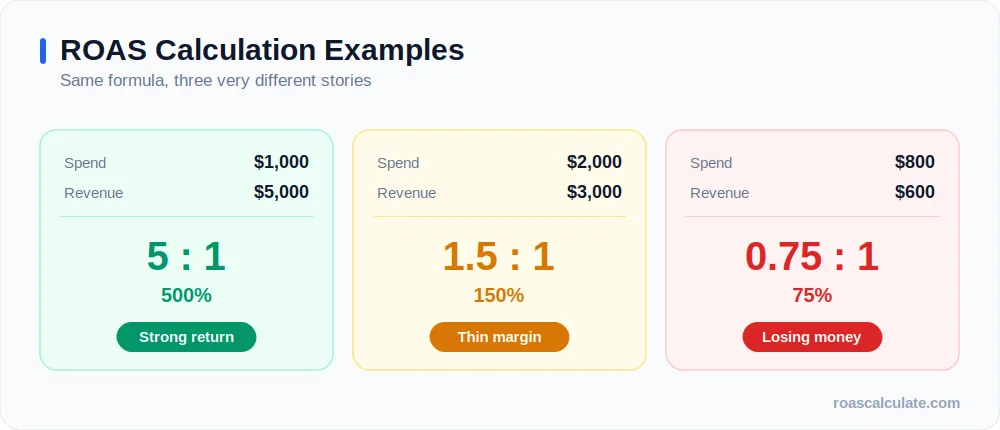
Example 1. You spend $1,000 on a Google Ads campaign. It generates $5,000 in ad revenue.
ROAS = $5,000 ÷ $1,000 = 5, or 5:1, or 500%.
For every dollar spent, you earned five back.
Example 2. You spend $2,000 on a Meta advertising campaign and pull in $3,000 in revenue.
ROAS = $3,000 ÷ $2,000 = 1.5, or 150%.
Still positive on paper, but thin once real costs come in.
Example 3. You spend $800 and the campaign returns $600.
ROAS = $600 ÷ $800 = 0.75, or 75%.
This is a low ROAS. You are losing money on every dollar spent on ads, and this campaign needs attention now.
Same ROAS calculation formula, three very different stories. That is why analyzing ROAS per campaign beats looking at one blended number for everything.
How to Calculate ROAS in Digital Marketing
In digital marketing, the inputs come straight from your ad platforms. Most of them report conversion value and spend side by side, which is half the work done for you. The skill is making sure those numbers are trustworthy before you divide.
Two things trip people up. First, attribution. If your ad platform claims credit for a sale that the customer actually found through organic search, your ROAS will look better than reality. Different attribution models (last click, first click, data-driven) will hand you different revenue figures for the same campaign. Pick one model, stay consistent, and compare like with like.
Second, currency and timing. Make sure ad revenue and advertising spend cover the exact same window and the same campaign. Mixing a month of revenue with a week of spend produces a ROAS figure that means nothing.
How to Calculate Your ROAS Using Revenue Data
To calculate your ROAS accurately, start from clean revenue data rather than estimates. Export the conversion value from your ad platform, then sanity-check it against your actual sales records. If your store shows $4,200 in sales tied to a campaign but the platform reports $5,000, trust your store.
Once revenue is solid, the rest is the same division you already know. Total revenue from ads divided by total cost of ads. If you sell products with different prices, use real order values, not an average, because a few high-value orders can swing the result a lot. Good revenue data in, trustworthy ROAS results out. Bad data in, and the prettiest formula in the world will still lie to you.
ROAS Calculator: A Faster Way to Calculate ROAS
You can do all of this by hand, and you should understand it by hand. But once you get it, a ROAS calculator saves real time. Type in revenue, type in spend, read the result. No formula to remember, no spreadsheet column to fumble.
A good ROAS calculator helps in two ways. It removes arithmetic mistakes, and it lets you test scenarios fast. Want to know what ROAS you need to hit profitability at a given budget? A calculator answers that in seconds. Our free ROAS calculator does exactly this, and it is built for marketers who want the number without the fuss.
If you prefer building your own, Google Sheets works fine too. A single formula cell dividing your revenue column by your spend column gives you a live ROAS metric you can update as campaigns run.
Understanding the ROAS Metric
Understanding ROAS is less about the formula and more about what the number is telling you. ROAS indicates efficiency, not total success. A campaign with a 10:1 ROAS that only spends $50 might matter less to your business than a 3:1 campaign spending $50,000.
This is why smart marketers read ROAS with other metrics beside it. Pair it with total spend, conversion rate, and average order value. ROAS provides the efficiency lens. The other numbers provide scale and context. On its own, the ROAS metric answers “how efficient,” not “how much did this move the business.”
ROAS vs ROI: Key Differences Explained
People use ROAS and ROI like they mean the same thing. They do not, and the gap between them can quietly mislead you.
Return on advertising spend looks only at ad revenue against ad cost. Return on investment looks at profit against your total investment, which includes product cost, overhead, and everything else. ROAS is the campaign-level view. ROI is the business-level view.
A campaign can have a great ROAS and a terrible ROI at the same time. That happens when your margins are thin enough that the cost of goods eats the gross revenue the ads brought in.
Difference Between ROAS and ROI
Here is the difference between ROAS and ROI laid out plainly:
Here is the difference between ROAS and ROI laid out plainly:
| ROAS | ROI | |
|---|---|---|
| What it measures | Revenue vs ad spend | Profit vs total cost |
| Formula | Revenue ÷ Cost of ads | (Profit − Investment) ÷ Investment |
| Includes product costs? | No | Yes |
| Best for | Judging ad performance | Judging overall profitability |
| Speed to calculate | Fast | Slower, needs full cost data |
Use ROAS to optimize campaigns week to week. Use ROI when you sit down to decide whether the whole channel is worth it. ROI and ROAS work together. One tunes the engine, the other checks if the car is going anywhere.
What Is a Good ROAS for Advertising Campaigns?
The honest answer nobody likes: it depends on your profit margin. A good ROAS for a business with 70% margins is very different from a good ROAS for one running on 15%.
That said, a common rule of thumb treats a 4:1 ROAS as the line where many ecommerce businesses start feeling comfortable. Above that often feels like a great ROAS, below it can still be fine if your margins are fat. The point is that “what is a good ROAS” has no single universal answer. The ideal ROAS is whatever clears your break-even point with enough room left for profit.
So when someone asks whether their ROAS is good, the real question back is: what does your business need to break even? Answer that first.
Average ROAS Benchmark by Industry
Benchmarks are useful for a gut check, not a target to obsess over. These are typical ballpark ranges people cite across industries. Treat them as rough orientation, since your own margins and pricing matter far more than any benchmark.
| Industry | Typical ROAS range |
|---|---|
| Ecommerce / retail | 3:1 to 5:1 |
| SaaS / subscriptions | 3:1 to 5:1+ |
| Travel & hospitality | 4:1 to 6:1 |
| Lead generation / B2B | 2:1 to 4:1 |
| Luxury / high margin goods | 5:1+ |
If your ROAS sits near the typical benchmark for your space, you are in normal territory. If it sits far below, dig in. If it sits far above and you are spending very little, you may be leaving growth on the table by under-investing.
What Is Break-Even ROAS?
Break-even ROAS is the ROAS where your ad revenue exactly covers all your costs, so you make neither profit nor loss. Below it you lose money, above it you profit. This is the single most useful number to know before you judge any campaign.
The formula is clean:
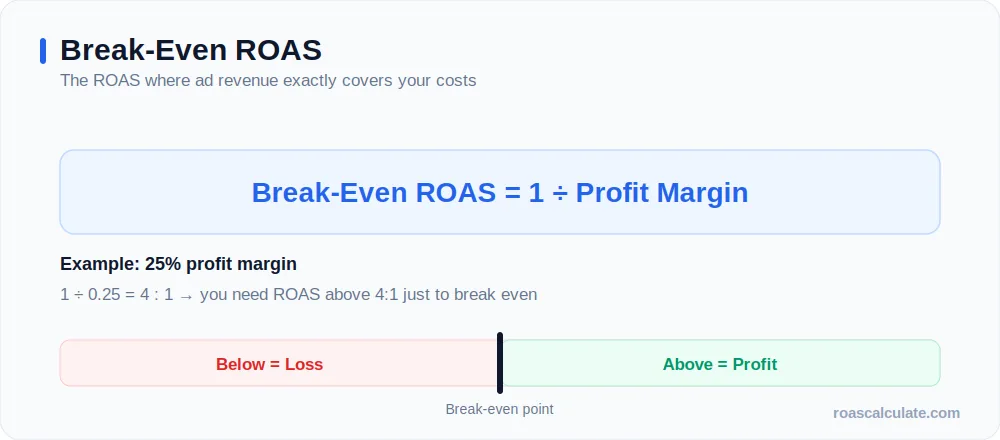
Break-Even ROAS = 1 ÷ Profit Margin
If your profit margin is 25%, your break-even ROAS is 1 ÷ 0.25 = 4. So you need a ROAS above 4:1 just to come out even on that product. If your margin is 50%, break-even drops to 2:1, and suddenly a “low” ROAS of 2.5 is actually profitable.
This is why two businesses can look at the same ROAS figure and reach opposite conclusions. Know your margin, calculate your break-even point, and a confusing number becomes a clear yes or no.
How to Track ROAS Across Marketing Channels
To track ROAS properly, measure it per channel before you blend it. Google Ads, Meta, email, and affiliate each deserve their own ROAS so you can see which channel earns its keep.
Set up consistent tracking first. Use proper conversion tracking and the same attribution window across platforms, otherwise you are comparing numbers that were never measured the same way. Then build a simple view, even a Google Sheets tab, where each channel’s revenue and spend sit side by side with a live ROAS column. Update it on the same schedule every time. Tracking your ROAS is only useful if it is consistent enough to spot a trend, not just a snapshot.
Measuring ROAS in Google Ads Campaigns
Measuring ROAS in Google Ads is straightforward because the platform reports conversion value and cost in the same place. Turn on conversion tracking, assign accurate values to your conversions, and Google will surface a “Conv. value / cost” column. That column is your ROAS.
The catch is the same one from earlier: trust but verify. Google Ads can be generous with attribution, especially with auto-applied or data-driven models. Cross-check the conversion value against your real revenue every so often. When you set automated bidding to a target ROAS, you are telling Google to chase efficiency at a level you choose, so make sure that target actually sits above your break-even ROAS, not below it.
Common ROAS Calculation Mistakes to Avoid
A few mistakes show up again and again, and each one quietly distorts the result.
- Using total store revenue instead of revenue from ads. This inflates your ROAS because you are crediting the campaign with sales it never drove.
- Forgetting some advertising costs. If you only count media spend and ignore agency fees or creative costs, your ROAS looks better than reality.
- Ignoring attribution. Letting the ad platform take full credit for every sale overstates ad revenue.
- Confusing high ROAS with profit. A strong ROAS means efficient spend, not guaranteed profitability. Always check it against break-even.
- Comparing campaigns over mismatched time windows. Same window for revenue and spend, every time.
Avoid these five and your ROAS calculation will actually reflect what happened.
How to Improve ROAS and Increase Revenue
To improve ROAS, you work both sides of the formula: lift the revenue from ads, or trim the cost of ads. Usually both.
On the revenue side, tighten your targeting so your budget reaches people more likely to buy, sharpen your ad creative and offer, and fix the landing page so the clicks you pay for actually convert. Raising conversion rate lifts ROAS without spending an extra cent. On the cost side, cut the keywords and audiences that drain budget with no return, and shift that spend toward the segments already performing.
A higher ROAS almost always comes from a few unglamorous fixes rather than one clever trick. Pause what loses money. Feed what makes it. Test offers. Watch the number move, then repeat. That loop is how marketers steadily push ROAS up over time.
Factors That Affect Your ROAS

Several things move your ROAS, some inside your control and some not:
- Profit margin, which sets your break-even and therefore what counts as a good ROAS.
- Ad targeting and audience quality, since better-matched audiences convert more.
- Creative and offer strength, which drives both click and conversion rates.
- Landing page experience, where a slow or confusing page quietly kills ad revenue.
- Attribution model, which changes how much revenue gets credited to ads.
- Seasonality and competition, which can swing advertising cost and conversion rates beyond your control.
Knowing which factor is dragging your number down tells you where to spend your next hour of work.
Final Thoughts on ROAS Calculation
ROAS is the cleanest first answer to whether your ad spend is working. Divide the revenue from ads by the cost of ads, read it as a ratio or a percentage, and you have a marketing metric you can act on today.
The number only earns its keep when you give it context. Pair it with your break-even ROAS so you know what “good” means for your margins. Read it next to scale and conversion data so a tiny efficient campaign does not get mistaken for your biggest win. And keep your inputs honest, because clean revenue and complete cost data are what separate a useful ROAS from a flattering one.
Run the formula, check it against break-even, and let the result guide where your next dollar goes. That habit, repeated campaign after campaign, is what turns ad spend into a system instead of a guess.
